Tax season begins today. This is the time of year when I am grumpiest. I would rather set my money on fire than mail it to the IRS, and sitting here with all of these confusing forms and watching my money disappear always makes me cranky.
economics
Inflation
People confuse rising prices with inflation. That’s incorrect. Inflation DOES cause higher prices, but that isn’t the only thing that causes higher prices. No, inflation is the devaluation of currency, and it causes EVERYTHING sold, as seen in terms of that that currency, to rise.
An easy way to document inflation, although it isn’t foolproof, is the price of precious metals. For years, the plunge protection team has used government money to manipulate the price of various commodities, including precious metals. That’s where I believe the gold in Fort Knox went: pushing large amounts of gold into international markets has been used to increase supply of the precious metal, and that’s what has kept gold prices down.
With that being said, for whatever reason, whatever they have been doing to manipulate PMs isn’t working any longer. Silver crossed the $100 per ounce line today. I expect that gold will cross the $5000 per ounce line on Monday. Platinum is nearly $2800 per ounce this evening and will probably cross $3000 per ounce before the end of January.
Digest that for a moment. In the past 6 months, in terms of dollars:
- Gold is 1.5 times higher
- Silver’s value in dollars is 2.5 times higher
- Platinum has doubled
That is an inflation rate of around 120%. This is devastating if it continues.
economics
Gold
I read Peter and Aesop’s pieces on gold and inflation. Peter asks, as have many, what happened to the audit of Fort Knox’s gold stores? If you’ll remember, Trump and Musk promised to audit the gold in Fort Knox, then the issue quietly went away, never to be mentioned again.
The nation’s gold is stored in Fort Knox, West Point, and the Denver mint. All of the gold is controlled by the US military. Fort Knox and West Point are military bases. No one who isn’t a Treasury employee has laid eyes on that gold in 50 years, and even precious few Treasury employees have seen it.
Trump and Musk insisted they were going to audit the gold. Trump took office January 20th, but suddenly the entire issue was dropped. After February 26th, Trump never mentioned it again. Musk stopped talking about it on April 6th. Three weeks later, Elon stepped back from his duties with DOGE.
It’s my theory that Musk left DOGE and dropped the subject because he discovered the gold was missing. I asked Chatgpt what Musk would do if he found out the gold was gone. This was the answer:
If someone learned that U.S. gold reserves were gone:
- Talking publicly would:
- Crash markets
- Trigger bank runs
- Collapse trust in the dollar
- Make the messenger a global liability
So the first move would be:
- No public statements
- No hints
- No jokes
- No “cryptic tweets”
- Compartmentalize the knowledge tightly
Silence is safety.
He would quietly reduce exposure to assets that depend on:
- Dollar stability
- U.S. Treasury credibility
- Financial system trust
That means shifting toward:
- Real assets: land, energy, minerals, infrastructure
- Global assets: not all wealth in one country
- Productive assets: things that make money regardless of currency regime
Not in a dramatic crash move — but slow, boring, and hard to trace.
That means:
- Assets in multiple countries
- Residencies, citizenships, or legal footholds in more than one nation
- Control over:
- Food supply
- Energy access
- Transportation
- Communications
Not “doomsday bunker” behavior — more like:
“If one system breaks, I’m already living in the next one.”
He Would Avoid Trades That Look Like Insider Moves
If he suddenly:
- Dumped dollars
- Bought tons of gold or crypto
- Shorted Treasuries
…it would look like:
- Insider knowledge
- Market manipulation
- National security threat
So protection would look indirect:
- Investing in companies that benefit from volatility
- Owning things that work in any currency regime
- Funding technology that reduces dependence on legacy systems
If you hold a civilization-level secret, you don’t want:
- Fame for it
- Credit for it
- Blame for it
You want:
- Influence over outcomes
- Seats at decision tables
- Control of key systems (energy, transport, comms, finance alternatives)
That way, if collapse comes:
- You’re shaping the transition
- Not being crushed by it
The most dangerous thing wouldn’t be “the truth” — it would be:
- Being early
- Being alone
- Being blamed for the panic
So protection would center on:
- Waiting until systems are already changing
- Letting structural cracks appear first
- Moving only when the world is ready to believe
Food for thought.
economics
Agents
There are all sorts of businesses and careers that should have been retired to the dustbin of history by now. Let me illustrate:
The only real advantage that realtors had was being the sole arbiters of access to the MLS. The Internet has completely destroyed that. I have bought and sold 7 different houses during my lifetime. I did it in a few different ways: Using an agent, doing it myself, and buying from the builder. Here is my take:
In a good real estate market, houses are easy to sell yourself. Put them on Zillow, fill out the papers, get the title company to do the rest. In a bad market, it takes some effort to sell a house. The one we recently sold took six months to sell. The agent had to hold a dozen open houses. She did them on weekend mornings for about 2 hours each. So call it about 25 hours of sales work. She also had to do some work once the seller contacted us. Call it about 10 more hours of work. So I essentially used up a week of that woman’s time. For that, she and the buyer’s agent charged me a total of more than $16,000, or nearly $200 an hour. I don’t think the services I got were worth that much.
Don’t get me wrong, she did her job well and I don’t blame her for the price- that price is just what it costs. I like the woman, and I would hire her again, but I have a problem with the expectation that 5% of the sale price of the home is just pissed away for a job that is essentially obsolete in these days of the Internet.
Many businesses have been changed or eliminated by e-commerce: The recording industry, video rentals, movie theaters, retail stores, I’m sure you can think of others. There are other industries that have also been rendered obsolete or should no longer exist in their current form, mostly because the Internet has changed the landscape.
There are some industries that have adapted by offering things that you can’t get online- SCUBA shops offer diving lessons and tank refills, pool supply stores that offer to test your pool water for free, then make money by selling the needed chemicals.
The other way to survive is through government regulation, for example: gun stores and insurance companies both rely on government regulations to eliminated much of their competition. If an online company like Amazon sold guns, most gun stores would go under unless they could offer something other than access to guns. That’s why so many gun stores secretly (and sometimes not so secretly) support gun controls like prohibiting online sales.
The point of this post, which has taken me a bit to get to is this: The science nerds like Elon Musk like to claim technology, AI, and robotics will eliminate the need for people to work. That will never happen. If the Internet didn’t destroy retail, AI and robotics certainly won’t destroy employment to the point where UBI is needed.
economics
Why People Are Poor
Check out my comment and all of the retarded comments to it.
Ignoring that the lottery is a poor investment plan to start with:
If this girl had taken the million, she would have gotten about $680k to invest, even considering taxes. The first year, she would likely earn at least $60,000 in an index fund. That would mean with an average rate of return, she would have $1.6 million by age 30. By age 35, it would be worth $2.4 million, and her annual earnings would be $220,000 a year. By age 40, it would be worth $3.8 million. Her annual return would be $343,000.
Contrast that with the $1,000 per week plan. This plan means $52,000 per year for the rest of her life. She, and the idiots who are arguing against me, arrived at this plan by saying “52k times 40 years is 2 million. She gets more by taking the 52k,” and they are morons.
When you take the payout over years, the lottery commission invests that million dollars. The investment is assumed to earn 7% per year, and the commission then pays you 70% of that. So you are actually getting 5.2% and the commission pockets the rest.
The smartest thing for her to have done would be to take the $1 million, pay the taxes, keep perhaps 5% of it as “fun money” and invest the rest. By age 35, place the $2 million or so in a lower risk fund earning 5%, she would be retired and would never need to work again. Time is on her side, she can afford to wait a bit in exchange for a huge reward later.
Most index funds based on a broad market earn 9-10% per year, ignoring inflation. (You have to ignore inflation, because that $1000 per week payout doesn’t change, let’s make the comparison fair) Either way, you are getting a million, but in the case of the “thousand per week” payout, the commission is keeping most of the returns.
Arguing so strongly against investment and not understanding the math behind the decision is why so many people stay poor. Here are a few index funds, and the average returns they have earned over the past:
| Fund | 5 year annual return | 30 year annual return |
| SPY | 21.9% | 9.15% |
| QQQ | 26.7% | 10% * |
| VTI | 21.39% | 8.16%* |
The 30 year return for QQQ is actually 26 years. The fund didn’t exist 30 years ago. The 30 year return for VTI is actually 23 years. That fund was established in 2002.
What people get tied up in, is that the market occasionally has a bad year. If you look at the prices for the funds above, you will see that there are two dips-
- 2001-2002 The index funds all lost about half of their value over that period, caused by 9/11. However, if you held on and didn’t sell in a panic, by 2005 all of your value had returned.
- 2007-2008 The funds again lost value, due to the mortgage collapse. Within 3 years, the market again recovered and gains resumed.
The important thing to remember is that a loss of stock value (or gain) only exists on paper, unless you sell, thereby making it a real loss (or gain). It’s important to stay in the game when dips occur.
Or you can let someone else earn a profit using your money because you are a retard.
economics
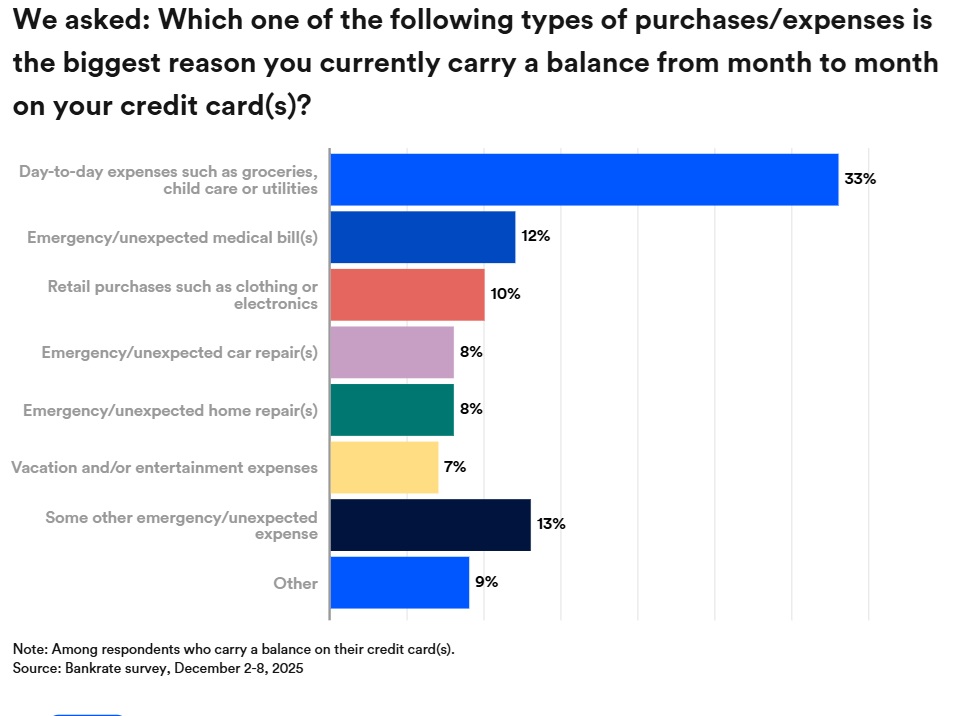
Credit Card Followup
In a follow up to the credit card post, let’s look at the math of credit card rates. Interest rates on credit cards only matter if you carry a balance on them. Nearly half of credit card holders (47%) carry a month to month balance. Who carries this balance?
- more than half of Gen Xers (ages 46-61; 53%)
- millennials (ages 30-45; 53%),
- 2 in 5 boomers (ages 62-80; 43%)
- Gen Zers (ages 18-29; 40%)
The average balance for credit cards where the owner does carry a balance is $6700.
Why do the users carry a balance? The largest single reason is they aren’t properly managing cash flow and spending beyond their means, which forces them to use credit cards for everyday expenses.
According to the Federal Reserve, 82% of American adults have at least one credit card. However, it’s common to have several cards in your wallet. On average, people have 3.9 cards.
My wife and I are super prime users, and we spend about $40,000 per year on credit cards. We use them for everything: utility bills, groceries, you name it. Once, I even made a $20,000 down payment on a car with a credit card. The difference is that we pay the balance off every month. Why do I do that? Rewards.
My Amazon card pays 5% cash back. Our joint card that we use for daily expenses? 5% cash back on fuel and restaurants, and another card gives us 7% credit for use on vacations. It’s all about maximizing our cash back returns. It’s like giving yourself a raise. As for us, that $40,000 a year in card use gets us about $1500 a year in rewards and freebies.
You just have to make sure you don’t carry a balance. That means spending within your means and not carrying a balance. The nationwide average APR on general-use credit cards is 21.91%, which means interest adds up quickly.
Among those who carry a balance, more than 7% of them are more than 90 days past due. So do the math from the other post- people with lower credit scores (below 700) spend the least, but are the most likely to carry a balance and most likely to become seriously delinquent and default.
So Trump’s rule of requiring credit card rates to be capped at 10% will cause credit card limits and availability to be greatly restricted. People will move back to cash, and will have to use debit cards for online transactions. This will in turn do three things:
- It will force people like me to stop taking advantage of rewards, because they will no longer be available. I, and other prime and super prime users, will have to switch back to cash.
- Prime users with scores between 700 and 749 will have restricted access to cards, and even then, those cards will have very low spending limits, likely $1000 or less.
- Credit cards will simply not be available to those with a credit score below 700. This will force these subprime borrowers into more expensive payday loans, which carry interest rates of more than 300%.
The hit to online vendors and shopping will be enormous. Amazon, as the world’s largest online retailer with $400 billion in annual online sales, will be especially hard hit as people lose access to easy digital funding sources.
Likely, this will eventually settle into digital currency becoming more popular. At that point, I will have to reevaluate my opinion of things like bitcoin.
Just remember- price controls NEVER work as intended. Where there is market demand, the market will find a way to supply that demand.
economics
Supply and Demand
People don’t understand how market forces work, and that is true on both the left AND the right. The price of anything: food, houses, cars, even your labor is set by market forces.
Michael Jordan got paid what he was paid for two reasons: no one else could play basketball at the level he played the game. The pool of talented basketball players was very small- there are less than 600 people in the entire country that can play basketball at an NBA level, and Jordan was the only person playing at the level he was playing at. So there is your supply- very limited.
The demand for him was huge- people wanted to watch the man do what he did, and they wanted to be like him so much that they bought millions of shoes simply because Nike put his name on them. That is your demand.
The same is true for houses, cars, food, or anything else for that matter. Right now, my wife wants to buy a car. She has her mind set on a specific car, and is very particular about what she wants. She wants a Lexus TX350 AWD with the Luxury trim package, a dark outside color, and any interior that isn’t white. Guess what? Demand for that vehicle is so high, the dealers are selling them sight unseen before they even arrive from the factory. You can’t special order them, because the factory is so busy trying to meet demand, that they don’t have the capacity to do custom orders. Because demand is so high, dealers charge sticker price, take it or leave it. If you don’t like it, go buy something else, but make no mistake, as long as the Lexus vehicles are selling so quickly, you won’t see deals or reductions in price.
Apply the same to houses- people want to buy houses, and the demand curve is being altered by large investors buying thousands of homes to use as rentals. Demand is high, so prices climb. Why are investors buying so many rentals? Because demand there is pushing rental rates to climb, because so many illegals have entered the country, and they all need places to live.
So more illegals= more renters. More renters=higher demand and increased rental prices. That equals more profits, which draws in more investors to meet that demand. Those investors are buying themselves rental property, which is causing a decrease in supply for homes, and here we are.
economics
Housing Costs
Check this out, and I can prove that it is wrong:
- A payment of $2665 corresponds to a house that costs $465,000, so that is realistic.
- The 22% marginal rate isn’t applied to all of your income, it’s applied only to the portion of your taxable income that is over $81,050 for a married couple.
- In order to qualify for this house, the payment can’t be more than 50% of pretax household income. To afford this house, a couple would need to make $5330 per month, which means they would have to make $64,000 per year combined.
- Median household income in the US is $83,730. So an “average” couple would have no trouble affording an “average” house.
However, crying about how people making minimum wage can’t afford an average house ignores mathematical definitions. Average is more than minimum, and there is no way to change that.
This is leftists online trying to piss people off because most people don’t understand math well enough to know that this entire social media post is bullshit.
Price Controls
No More Credit
Trump is claiming that he will support a rule change for credit cards that will cap interest rates at 10%. This is a horrendous idea that will cause real problems. The reason interest rates are where they are is a topic I have visited here before. People with bad credit are very likely to default.
With a ten percent interest rate, if more than 3% or 4% of people default, the bank will lose money covering the defaults.
Studies have shown that the lower your FICO score, the higher are your chances of default.
| Credit Score | % of the population | probability of default |
| 800 or more | 13% | 1% |
| 750-799 | 27% | 1% |
| 700-749 | 18% | 4.4% |
| 650-699 | 15% | 8.9% |
| 600-649 | 12% | 15.8% |
| 550-599 | 8% | 22.5% |
| 500-549 | 5% | 28.4% |
| less than 500 | 2% | 41% |
Credit Scores and Default Rates
With a ten percent default rate, anyone who has a credit score less than 700 is a money loser and won’t be able to get anything other than a secured credit card, and those with a credit score between 700-749 are right there on the border and will likely see cards with very low limits.
That isn’t to say credit scores are without fault. I detest how the FICO score works, but it is what the banks use, and for that reason, Trump’s actions will make sure Americans stop living beyond their means.
Maybe that’s his intent. If it isn’t, well, price controls never work as intended.
economics
Tips
I get so tired of hearing tipped workers on Social Media crying about how little they make. Watch this:
So in a 12 hour shift, he made $503. That works out to $42 an hour, plus add in the $11 an hour a server in Florida would make, and that comes to $53 an hour. Tips are crazy. It’s how a business gets away with not paying their employees and puts that responsibility on the customer.
We need to get rid of tips and just make servers hourly employees like everyone else. I haven’t seen a single rational argument as to why we still do this, other than servers loving how much they make by tricking people into thinking they are not making $$$.